How is Everyone’s Euglena Analyzed? – Part 4: Comparing the Read DNA
How are the euglena samples, collected and sent by people from various places, analyzed in the laboratory of the Microalgal Production Control Technology Research Team?
The procedure is divided into four main steps:
- Cultivating the samples sent to us,
- Isolating them using a cell sorter,
- Reading the DNA sequence of each cultivated euglena candidate, and
- Comparing the read DNA sequences. In this article, we will introduce the comparison of the read DNA sequences.
Expressing Feature Comparisons with a Phylogenetic Tree

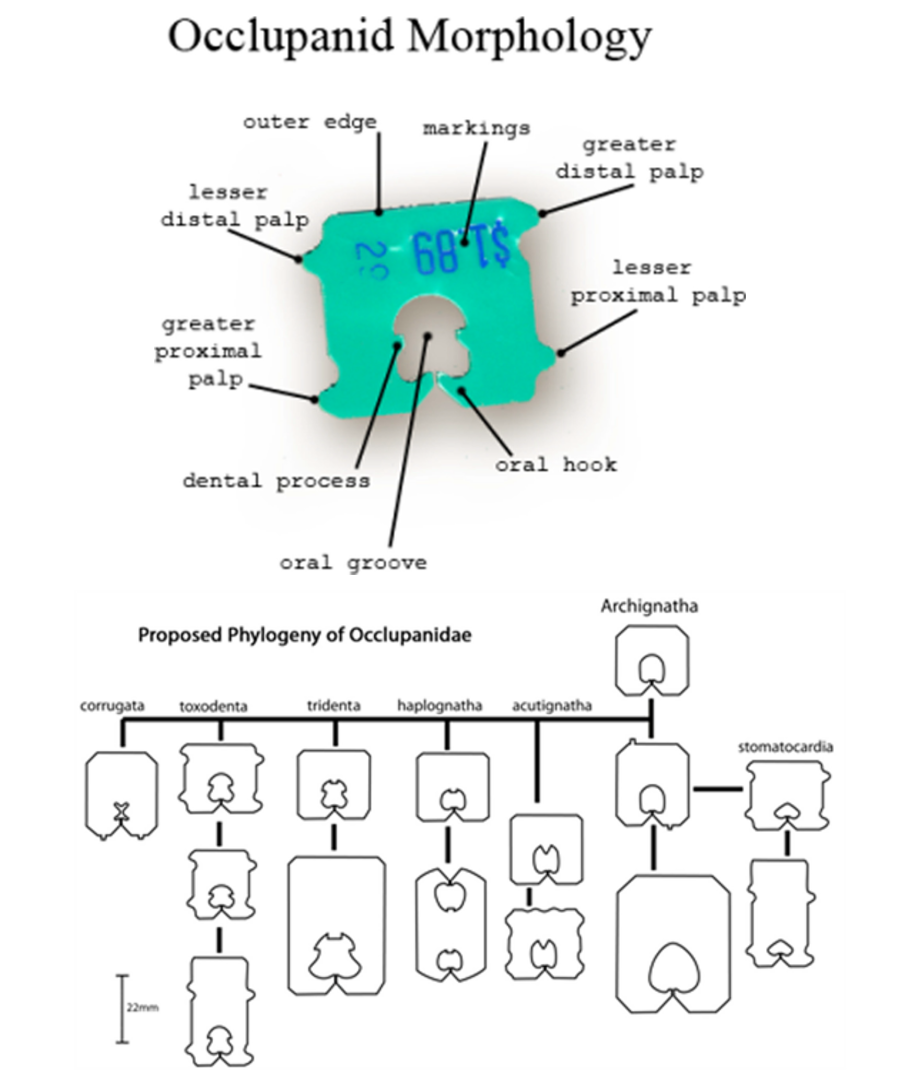
Figure 1: Clip features and phylogenetic tree (Modified from Reference 1)
Have you ever heard of a "phylogenetic tree"? The DNA sequences read from the euglena samples are compared using this tree.
A phylogenetic tree represents differences in certain features using a tree structure. For instance, consider the clips in Figure 1, which you might recognize as the ones used to seal bread bags. Even a single clip has many features (as shown in the top part of Figure 1), and by comparing these features, it's possible to express the relationships between various clip shapes using branching. Indeed, when looking at the phylogenetic tree of clips, clips in the same group (same vertical column) look somewhat similar (as shown in the bottom part of Figure 1).
Expressing DNA Sequence Comparisons with a Molecular Phylogenetic Tree

Figure 2: DNA Sequence Analysis Results
Now, let's look at the phylogenetic tree for euglena, similar to the clips. Figure 2 represents the molecular phylogenetic tree, which was created by reading the DNA sequences (ITS2) of each cell strain established from the euglena samples. Note: When comparing DNA in a phylogenetic tree, the term "molecular" is added.
While it's a bit more complex than the clip tree, you can see branching as you move from left to right. Branching points indicate differences in sequences. Samples on the same branch tip have almost identical DNA sequences. The length of the branches represents the time taken for the DNA sequence to change.
Looking at the results, it's fascinating to see that even within the same sub-group (branch tip), there are strains derived from samples collected in places like Niigata and Saitama, while others from Kanagawa are in quite distant sub-groups. Features like cell proliferation are analyzed considering each euglena strain's sub-group.
Please take a closer look (by enlarging the figure) to see which sub-group the euglena strain you collected belongs to. How about the strains from your neighbors?
References
- Lehmer LM, et al. Plastic bag clip discovered in partial colectomy accompanying proposal for phylogenic plastic bag clip classification. BMJ Case Rep. (2011)